TAC Sponsor Spotlight Article – McElhanney
Traditionally, collecting parking data involves sending personnel into the field to gather information throughout the day — a process that can limit the utility, accuracy, and granularity of the data collected. To overcome these challenges, McElhanney developed a more effective, efficient, and insightful approach to parking data collection and processing.
By using Remotely Piloted Aircraft Systems (RPAS) equipped with cameras, our team conducts drone missions along pre-planned routes, capturing entire areas of study at regular intervals. These images are then stitched together to create an orthomosaic that can be viewed and compared over various time periods, enhancing efficiency in delivering visual insights into how parking behaviours evolve.
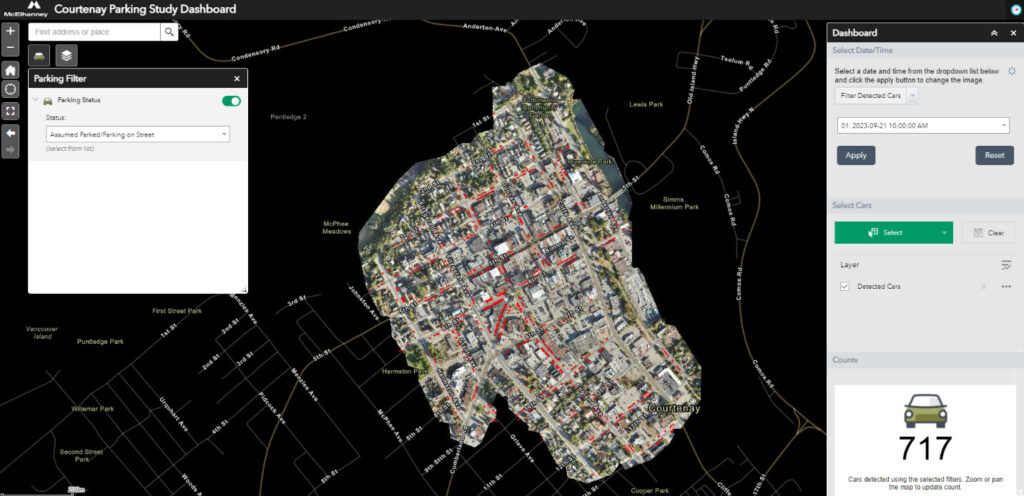
Additionally, McElhanney has developed an internal GIS dashboard that allows all collected orthomosaic files to be imported for further analysis — this is where innovative value is found. The dashboard utilizes machine learning algorithms to detect vehicles and has filtering capabilities that allow for the differentiation between on-street, off-street, and on-road vehicles. With various client needs in mind, the dashboard has also been developed with a series of filters and tools to enable clients to undertake their own analysis, focusing on whichever area within the study is of interest, such as reviewing the parking demand on an individual corridor or parking lot, or understanding the relative difference between on- and off-street parking demand.

Benefits & Capabilities of McElhanney’s GIS Dashboard
- Lower costs by reducing the need for count personnel.
- Rapid data interrogation and ability to generate bespoke insights.
- Improved data output validation, as images are always available for review and cross-checking.
- Provides dynamic and visual materials for engagement with the community, businesses, or developers.
- Capable of capturing data during inclement weather.
- Allows for investigation and analysis of data sets not specified prior to data collection.
- Capable of identifying bike parking, including the turnover of bike parking.
Customizing Our GIS Dashboard: A Case Study with the City of Courtenay
During the Courtenay Downtown Parking Study, McElhanney gathered data using RPAS. After importing the data into our GIS portal, we developed a series of specific analytical tools to provide users with the ability to interrogate and export findings. The primary function of the GIS software is to run vehicle identification algorithms that locate and automatically count vehicles within the images. In addition to this core functionality, our team also developed the following tools:
- Layers: This allows the user to show or hide ‘detected cars,’ ‘roads,’ ‘building footprints,’ and ‘drone imagery,’ depending on what the user would like to see.
- Parking Filter: This allows the user to differentiate between vehicles that are being driven on the road and vehicles parked in either on-street or off-street parking lots.
- Date Filter: This allows the user to select the date and time period to review, based on the surveyed data (which can be added to over time).
- Select: This function allows the user to create a shape within the image and only count cars within this area.
- Export: This allows the user to select a time period, location, and/or filter and export the results across a range of times or dates to a .csv file, which can then be opened in Microsoft Excel for further analysis and reporting.

